Kelly Shreeve

Data Scientist with M.A. in sociology, B.A. in environmental sociology, and 5+ years' experience teaching statistics. Completed TripleTen's 10 month data science bootcamp and a real-world data science externship with DataSpeak. Currently accepting data analysis and statistics consulting projects May 2024.
View My LinkedIn Profile
Visualizing Coffee Quality

Project Overview
This project uses high-level plotly visualizations to visualize coffee quality across the world. Using a dataset of 207 coffee batches from different regions and of different varieties, the purpose is to determine which region, variety, and altitude produce the best quality coffee.
Installation and Setup
Codes and Resources Used
- Editor Used: Visual Studio Code
- Python Version: 3.10.9
Python Packages Used
- Data Manipulation: pandas
- Data Visualization: matplotlib, plotly.express
Data
Data Files
Coffee Quality and Sustainability
- country_of_origin: Country coffee was grown in
- color: Color of the coffee bean
- variety: Coffee bean variety
- Aroma: Refers to the sent or fragrance of the coffee
- Flavor: The flavor of coffee is evaluated based on the taste, including any sweetness, bitterness, acidity, and other flavor notes.
- Aftertaste: Refers to the lingering taste that remains in the mouth after swallowing the coffee.
- Acidity: Acidity in coffee refers to the brightness or liveliness of the taste.
- Body: The body of coffee refers to the thickness or viscosity of the coffee in the mouth.
- Balance: Balance refers to how well the different flavor components of the coffee work together.
- Uniformity: Uniformity refers to the consistency of the coffee from cup to cup.
- Clean Cup: A clean cup refers to a coffee that is free of any off-flavors or defects, such as sourness, mustiness, or staleness.
- Sweetness: It can be described as caramel-like, fruity, or floral, and is a desirable quality in coffee.
- Category One Defects: Primary defects perceived through visual inspection of the coffee beans
- Category Two Defects: Secondary defects that can only be percieved through tasting
Data Acquisition
The data come originally from the CQI web database on coffee quality and sustainability and were made available through TripleTen.
Data Preprocessing
Missing values in string variables were imputed with ‘unknown’. Only one row was missing quantitative data and was dropped from the dataset. Implicit duplicates in color were cleaned by combining similar categories. Altitude values entered into the dataset as ranges were used to calculate an average altitude feature, representing the average of the two endpoints of the altitude range.
Code Structure
  ├── README.md
  │
  ├── images
  │   └── coffee.png
  │   └── quality_altitude.png
  │   └── quality_country.png
  │   └── total_points_variety.png
  │
  ├── modules
  │   └── __init__.py
  │   └── pre_processing.py
  │   └── read_data.py
  │
  └── notebooks
      └── coffee_analysis.ipynb
Results and Evaluation


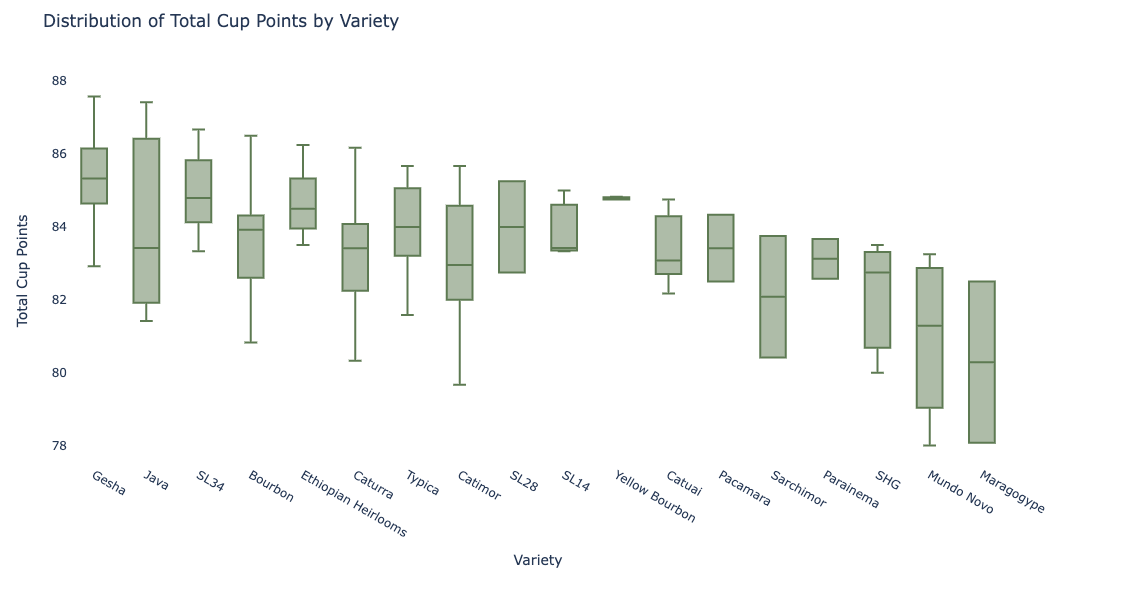
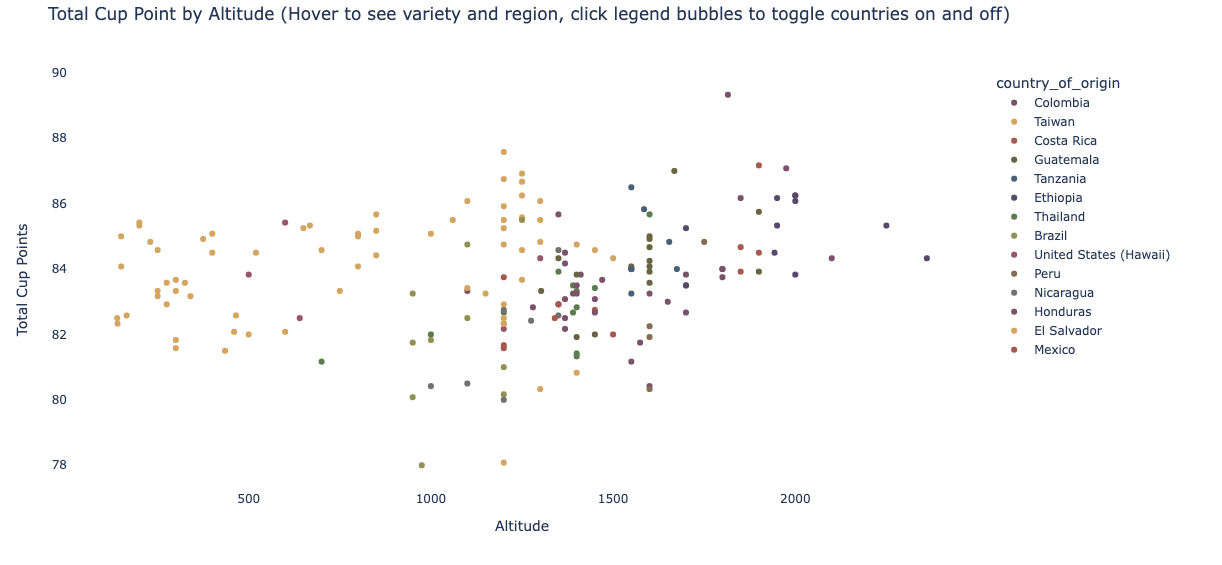
Based on the coffees in this data, you’re better off choosing coffee by strain than by country, particularly Gesha, Java, SL34, and Ethiopian Hierlooms tend to be consistently highly rated in all quality areas. Generally, you can’t know which coffee will be the best based only on country of origin, though Columbia does grow the single most highly rated coffee in the Piendamo, Cauca region, and Ethiopian coffees are rated the highest most consistently. Definitely don’t choose coffee based on bean color. You can expect that coffee grown at higher altitudes will have slightly better quality across multiple quality measures than coffee grown at low altitudes.
But ultimately, the coffee batches in this data were all outstanding quality and rated consistently high, with total cup points only varying between 78 and 90 points out of a possible 100. This dataset represents some high quality coffee, and we can only determine so much about what makes good and bad coffee from a dataset with all outstanding quality.
Future Work
In future work, additional data should be brought in with larger quality variation to determine what makes good and bad coffee. Additionally, other factors that can affect quality, such as rain fall, humidity, and shade levels, could be analyzed to determine if they have marked impact on quality.
Acknowledgments/References
Data from TripleTen’s Data Science Data Visualization Weekend Challenge.